I used to work as a financial analyst in Autodesk for 3 years which is a publicly-traded company with 10,000+ employees. During my time there I saw how the workflows of the Finance department were organised, what tools were used and how teams were structured.
All these things together allowed the finance department to produce effective data analytics ensuring predictable performance and financial management.
In this article I want to talk about my experience in Autodesk to help other companies choose their software stack, structure their teams and get more value from financial data analytics.
Finance Team Structure
Firstly, instead of the Finance department being separate, it was grouped together with the sales department. There were a lot of workflows that involved both the sales and finance teams.
Secondly, the sales team was segmented into different sectors: architecture and construction, manufacturing, entertainment, etc. Each of those sales teams had a dedicated finance business partner whose job was to support the sales team with data and forecast the quarterly performance.
The finance business partners worked closely with their respective sales teams and updated their quarterly forecasts every week. Those forecasts were then passed to the Finance Director whose job was to aggregate them into EMEA forecasts.
I was a part of a separate financial analytics team in Autodesk. We had 4 financial analysts and one manager, all responsible for producing and maintaining Power BI financial dashboards for finance business partners, sales and finance directors and VPs of sales and finance.
Financial Analytics Processes
There were a few key processes that the finance team was working on every week and sometimes every quarter. These included: reporting to the sales teams on their actual performance, forecasting the quarterly performance and tracking operation expenses.
Financial Forecasting
This was arguably the most important process that we followed. Here is how it would go:
All the finance business partners would have calls with their respective sales teams and review the sales data in the CRM. They would forecast the new business KPIs based on the data in the CRM.
The finance business partners would also identify several deals in the late stages of negotiations with a significant value. Those deals would be separately discussed with the finance director during the calls as they have significant impact on the forecasted KPIs.
At the same time, the FA team I was a part of worked on refreshing the main KPI dashboard with the latest data. This would allow the financial business partners to check the current performance on all the KPIs before submitting their forecast.
Finally, all the financial business partners would have a call with the financial director and VP of Sales to present the actual performance on all the KPIs, their forecast and compare it with the annual budget.
Weekly Financial Reporting to Sales Teams
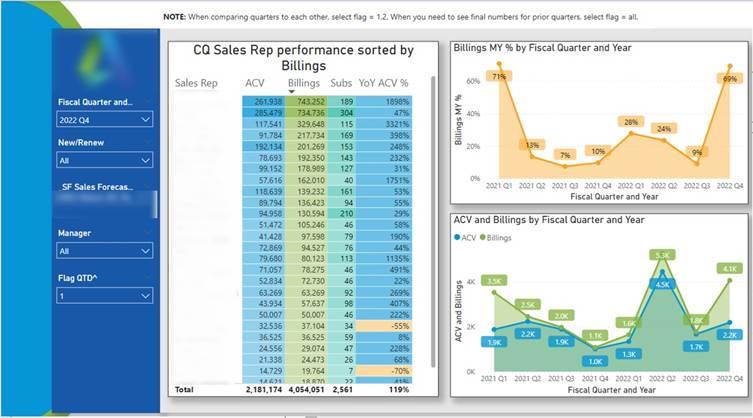
Our financial analysis team would also support the sales teams with tailored reporting. Every sales team had their own weekly performance dashboard that would be refreshed twice a week.
The dashboard included deeper analysis such as:
-Revenue by salesperson and manager
-Revenue by offer type
-Revenue by new vs renew business
-Biggest deals
In all of our reports we compared the current quarter vs previous quarter and previous year for more context.
This reporting was aimed to drive the conversations between the sales directors, managers and finance business partners. The financial business partners used it to identify strong and weak areas of growth within the team and brainstorm on how to maximise sales per quarter.
Analysing Client Portfolios
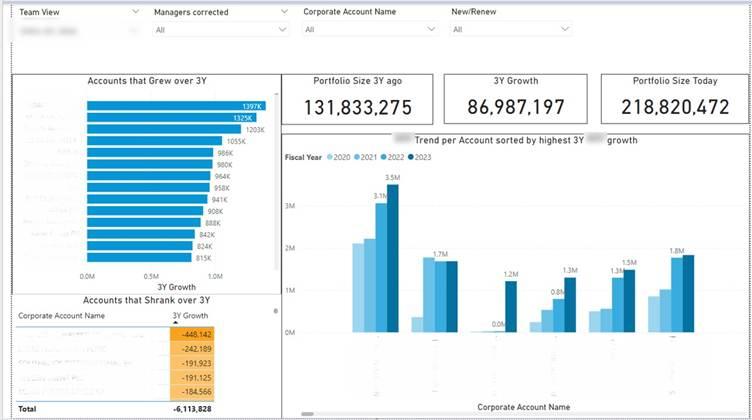
One goal of every salesperson in our company was to grow the business from their portfolio of clients over time.
Being in the financial analysis team we also supported the sales teams by analysing which parts of their portfolio were growing vs shrinking. This analysis was available to every sales person and sales manager.
The goal was to help sales people identify which accounts are shrinking and encourage them to actively work with these accounts. Equally if some accounts were growing, they could be upsold further.
We also created similar analysis for various industries and offer types to ensure that the salespeople were aware of the market trends.
Financial Analysis Software Stack
We used several key tools in our daily work:
We used Anaplan for forecasting. Every finance business partner would load their weekly forecast into Anaplan and the Finance Directors would then record their adjustments there. This data would then be automatically pulled into our reporting.
The sales team used Salesforce as their CRM. The Salesforce data would then be used to drive conversations between the finance business partners and sales managers they supported.
We also used Power BI for creating our financial reports. Power BI allowed us to automatically extract the data from our data sources including Anaplan and Salesforce. Power BI also helped us to analyse larger volumes of data and visualise the data effectively.
We also stored our data in a data mart but the choice of technology there was quite questionable. If you are planning where to store your actual sales data, I would encourage you to choose an ERP that has integrations with Excel, Power BI or other analytics systems that you are using.
Conclusion
Effective financial analytics depends on many factors. The most important one in my opinion is a stable sales process that you build your financial analysis around.
The structure of your financial analysis team comes second in my opinion. However, the key is to ensure that the finance team is closely partnered with the sales team. This means that the finance team needs to create analysis that helps the sales team to identify opportunities and create more predictability in the financial performance.
You would then need to choose the software stack that enables your analysis through integrations between different systems. Without these integrations, the people would find the systems limiting which leads to lack of innovation.